A PageSpeed score of 43 sounds bad. It might not be. A score of 91 sounds good. It might still have a problem buried in it that’s costing you visitors. The number is where the investigation starts, not where it ends.
Most speed testing guides hand you a list of tools and stop there. This one covers the tools, explains what to actually look at in the results, and tells you the thing almost nobody explains: whether a slow number is a hosting problem or a code problem. Those are different problems with completely different fixes.
Why Your Speed Score Isn’t What You Think It Is
Google’s PageSpeed Insights mobile test simulates a slow 4G connection on a low-end device. That’s the environment it uses to calculate your score. Most of your actual visitors are on better connections than that.
A mobile PageSpeed score of 55 or 60 isn’t a failing grade for a site that performs well in practice. It’s a synthetic test run under conditions close to worst case. What matters more than the headline number is the group of individual metrics underneath it, particularly the Core Web Vitals. Those are what Google uses as ranking signals, and they’re measured from real users on real devices, not a simulated slow phone.
The headline score is a useful flag for obvious problems. Don’t spend weeks chasing 100.
The Two Types of Speed Data
Speed testing tools produce two fundamentally different types of data. Confusing them is one of the most common mistakes when reading test results.
Lab data comes from a controlled simulation. GTmetrix, Lighthouse, and WebPageTest all produce lab data. Results are consistent and repeatable, which makes them useful for diagnosis: run a test, make a change, run it again, see if anything improved.
Field data comes from the Chrome User Experience Report (CrUX) and is collected from real visitors.. Google PageSpeed Insights shows field data near the top of its report, labelled as Core Web Vitals. It’s averaged from Chrome users visiting your site over the past 28 days. This is what Google uses for ranking, because it reflects what your actual users experience rather than a controlled test environment.
The practical implication is simple. If your field data shows good Core Web Vitals but your lab score is 52, you’re probably fine. Real users are having a good experience and that’s what counts. If your field data shows problems, that’s where to focus, regardless of what the lab score says.
| Data type | Where it comes from | What it’s for | Used for Google rankings? |
|---|---|---|---|
| Lab data | Simulated test (GTmetrix, Lighthouse) | Diagnosing specific issues | No |
| Field data | Real Chrome users on your site | Understanding actual user experience | Yes |
If your site is new or low-traffic, PageSpeed Insights may not have enough field data to show Core Web Vitals yet. In that case, the lab data is your best starting point. Once your site has enough visitors, field data will appear automatically.
The Three Tools Worth Using
There are dozens of speed testing tools. Most of them tell you the same things through slightly different interfaces. These three cover everything that actually matters.
Google PageSpeed Insights (free). The most important tool for most people. It shows both field data from real Chrome users and lab data from a simulated test. Start here. It also gives you specific suggestions for what to fix, prioritised by impact.
GTmetrix (free tier available). Better for drilling into specific problems. GTmetrix produces a waterfall chart showing every resource your page loads, in order, with timings for each one. When a page is slow and you don’t know why, the waterfall is where you find the answer. It shows you exactly which file or script is causing a delay.
TSH Server Response Tester (free). Measures your Time to First Byte from multiple locations, which tells you how fast your server is responding before any page content is involved. If that number is slow, the problem is the server, not the content on the page. Test your server response time here. It’s the quickest way to rule hosting in or out as the cause before doing anything else.
Pingdom, WebPageTest, and Lighthouse in Chrome DevTools are worth knowing for deeper investigations. For routine testing, these three are enough.
What to Look at in Your Results
The headline score isn’t what to focus on. These four metrics are.
LCP: Largest Contentful Paint How long until the main content on your page finishes loading. Usually a hero image, a large heading, or a banner at the top. Should be under 2.5 seconds. LCP is the metric most directly tied to how fast your page feels to a visitor arriving for the first time, and it’s the one most often caused by slow images or a slow server response.
INP: Interaction to Next Paint How quickly your site responds when someone clicks or taps something. INP replaced FID (First Input Delay) as a Core Web Vital in 2024. Many speed guides still reference FID thresholds, which are no longer current. INP should be under 200ms. High INP is almost always a JavaScript problem, not a hosting problem.
CLS: Cumulative Layout Shift Whether elements move around as the page loads. If you’ve ever gone to tap a button only for an ad to push it down at the last second, that’s high CLS in action. Should be under 0.1. Common causes: images without defined dimensions, ads injected after load, late-loading embeds.
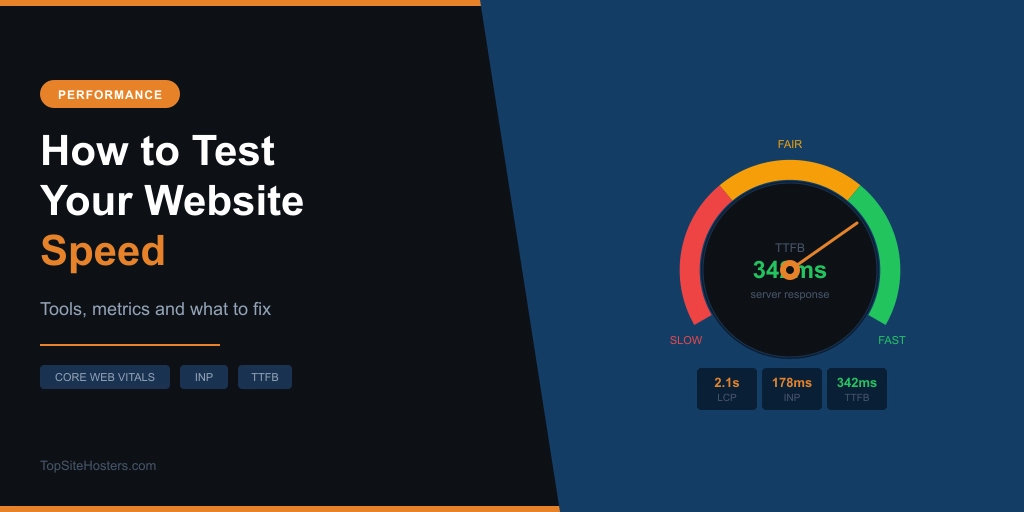
TTFB: Time to First Byte How long your server takes to start sending data back after receiving a request. Should be under 800ms. TTFB is the metric most directly connected to hosting quality. Everything above the TTFB line is your server’s job. Everything below it is your code’s job.
What Good Numbers Look Like in 2026
Here are Google’s Core Web Vitals thresholds, which are what ranking signals are based on. These apply to both desktop and mobile, though mobile is harder to achieve because of the simulated device conditions.
| Metric | Good | Needs work | Poor |
|---|---|---|---|
| LCP | Under 2.5s | 2.5s to 4.0s | Over 4.0s |
| INP | Under 200ms | 200ms to 500ms | Over 500ms |
| CLS | Under 0.1 | 0.1 to 0.25 | Over 0.25 |
| TTFB | Under 800ms | 800ms to 1,800ms | Over 1,800ms |
For context: the average website loads in about 2.5 seconds on desktop and 8.6 seconds on mobile in 2026. Mobile is slower partly because the test simulates weaker hardware and connectivity. If your desktop LCP is under 2.5 seconds and your Core Web Vitals are in the green, you’re ahead of most sites on the web.
Don’t get derailed by a mobile PageSpeed score in the 40 to 60 range if your field data shows good Core Web Vitals. The score and the actual user experience are not the same thing.
When Slow Numbers Are a Hosting Problem
This is the part most speed guides skip, and it’s the most useful distinction to understand.
Slow numbers come from two different sources: your server, and your code. The fixes are completely different. Upgrading your hosting won’t fix a JavaScript problem. Compressing your images won’t fix a slow server. Knowing which one you’re dealing with saves a lot of wasted effort.
These point to a hosting problem:
- TTFB consistently over 800ms, especially when tested from your target audience’s location
- Slow server response on simple pages with minimal content
- Performance that gets noticeably worse as traffic increases
If your TTFB is consistently over a second on shared hosting, your server is likely overloaded or geographically far from your visitors. The fixes are moving to a faster host, adding a CDN to serve content from servers closer to your audience, or stepping up from shared to VPS hosting. Shared hosting vs VPS: when does the upgrade make sense?
These point to a code problem:
- High LCP caused by large images that haven’t been compressed or converted to modern formats
- High CLS from images without defined width and height attributes
- High INP from heavy JavaScript, too many plugins, or third-party scripts blocking the main thread
- Slow load times that don’t improve even when tested from a server in the same location
These need on-site work rather than a hosting upgrade. Compressing images, auditing plugins, deferring non-critical scripts, and enabling caching make more difference here than any server change.
The quickest way to work out which category you’re in: run a TTFB test before anything else. If your server response time is fast and your site is still slow, the problem is in the code. If TTFB is slow, start with the hosting.
Common Questions About Website Speed
How often should I test my website speed?
A baseline test every month or two is enough for most sites. The more useful habit is testing immediately after any significant change: a new plugin, a theme update, a hosting migration. That way you’ll know straight away whether the change helped or hurt. Google Search Console’s Core Web Vitals report also tracks real user data continuously and will surface issues as they appear.
Why does my PageSpeed score keep changing between tests?
PageSpeed scores vary between runs because the test is sensitive to network conditions and server load at the moment it runs. A single result isn’t reliable on its own. Run the test three to five times with a few minutes between each and take the average. Field data in PageSpeed Insights is far more stable, because it’s averaged from real users over 28 days.
What is a good TTFB score?
Under 800ms is good. Under 500ms is strong. Over 1,800ms is worth addressing. TTFB is the metric most directly controlled by your hosting: server location, available resources, and whether server-side caching is working properly all affect it. If your TTFB is consistently slow from your target audience’s location, hosting is almost certainly part of the explanation.
Does hosting affect my Google ranking?
Yes, indirectly. Google uses Core Web Vitals as a ranking signal, and TTFB is a component of how LCP is measured. Slow server response raises your LCP, which can push you into the needs-improvement or poor range and affect how Google evaluates the page experience. Fast hosting won’t overcome thin content, but slow hosting can hold back a site that deserves to rank.
My mobile score is much lower than my desktop score. Is that normal?
Yes, and expected. Google’s mobile test simulates a slow 4G connection on a low-end device, which is more demanding than the conditions most real mobile visitors are on. A mobile score between 50 and 70 is common for sites that perform well in practice. The more useful check is your Core Web Vitals field data for mobile in Google Search Console, which shows how real mobile visitors are actually experiencing your site.