What Are Core Web Vitals?
Google's three metrics for measuring real-world page experience: LCP, INP, and CLS. A direct ranking factor, and your hosting directly affects your scores.
Core Web Vitals are a set of specific metrics Google uses to measure the real-world user experience of a web page. They focus on three aspects of page experience: loading performance, interactivity, and visual stability.
Google uses Core Web Vitals as a ranking factor. Pages that perform well on these metrics have an advantage in search results over pages that perform poorly, all else being equal. More importantly, pages that perform well on these metrics provide a genuinely better experience for visitors.
There are three Core Web Vitals:
- LCP (Largest Contentful Paint): How fast does the main content load?
- INP (Interaction to Next Paint): How quickly does the page respond to user input?
- CLS (Cumulative Layout Shift): Does the page layout shift unexpectedly while loading?
Each metric has defined thresholds: a “good” range, a “needs improvement” range, and a “poor” range. Google assesses pages against these thresholds based on real user data collected through Chrome.
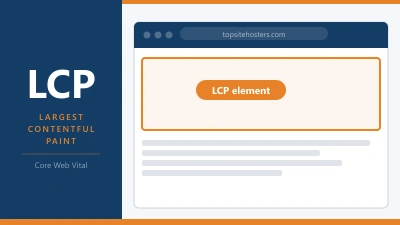
LCP: Largest Contentful Paint
LCP measures the time from when a page starts loading to when the largest visible content element in the viewport has fully rendered. This is usually a hero image, a large block of text, a video thumbnail, or a feature image.
Thresholds:
- Good: under 2.5 seconds
- Needs improvement: 2.5 to 4.0 seconds
- Poor: over 4.0 seconds
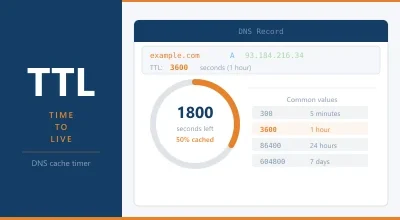
LCP is the Core Web Vital most directly affected by your hosting. A slow server means a slow TTFB, which delays when the browser starts receiving and rendering content. Everything about your page’s loading sequence, server response time, caching, CDN configuration flows into LCP.
Common causes of poor LCP:
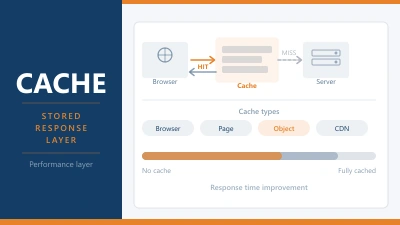
Slow server response time: If your server takes 1.5 seconds to respond, LCP can’t complete in under 2.5 seconds even with a perfectly optimised page. Server-side caching and a fast hosting provider are the most impactful fixes.
Render-blocking resources: CSS and JavaScript that block the browser from rendering content delay LCP. Critical CSS should load immediately. Non-critical scripts should be deferred.
Slow image loading: If the LCP element is an image, its loading speed matters directly. Using next-gen formats (WebP, AVIF), appropriate image sizes, and the fetchpriority="high" attribute on the LCP image all help.
No CDN: Visitors far from your server experience higher latency. A CDN serves assets from locations closer to the visitor, reducing the time images and files take to arrive.
Resource discovery: If the LCP image is set as a CSS background rather than an <img> tag, the browser discovers it later in the loading process. Keeping your LCP element in the initial HTML as a native <img> tag helps the browser start loading it as early as possible.
How hosting affects LCP
Your choice of hosting has a direct and measurable impact on LCP. Here’s the chain:
- Visitor requests the page
- Server processes the request (PHP execution, database queries)
- Server sends the HTML response (TTFB)
- Browser receives HTML and starts loading resources
- LCP element fully renders
A managed WordPress host with server-level page caching (like Kinsta or Rocket.net) can deliver a cached HTML response in under 50ms. A slow shared host without caching might take 1.5 seconds just to generate and send the HTML. That difference alone determines whether LCP is “good” or “poor.”
INP: Interaction to Next Paint
INP replaced FID (First Input Delay) as a Core Web Vital in March 2024. It measures the responsiveness of a page throughout the entire visit, not just the first interaction.
INP captures the delay between a user input (click, tap, key press) and the next time the browser paints a visual update in response. It measures the worst-case interaction during the visit (with some outliers excluded) and uses that as the page’s INP score.
Thresholds:
- Good: under 200 milliseconds
- Needs improvement: 200 to 500 milliseconds
- Poor: over 500 milliseconds
INP is primarily a JavaScript performance metric. Long JavaScript tasks that block the main thread delay how quickly the browser can respond to user input. Common causes:
Large JavaScript bundles: Too much JavaScript means the browser spends more time parsing and executing code, leaving less time to respond to interactions. The rise of JavaScript-heavy page builders and plugins has made this a common issue on WordPress sites.
Long tasks on the main thread: Any JavaScript task running for more than 50ms is considered a “long task.” Tasks longer than 50ms block the browser’s ability to respond to user input until they complete. Splitting long tasks into smaller chunks (yielding to the browser between them) is the technical fix.
Third-party scripts: Analytics, chat widgets, advertising scripts, and social media embeds all add JavaScript that can contribute to long tasks. Each third-party script is a potential INP problem.
Inefficient event handlers: Poorly written JavaScript that does too much work in response to a user action (reading layout properties, triggering reflows, running complex calculations) creates slow interactions.
How hosting affects INP
Hosting has a smaller direct impact on INP than on LCP. INP is primarily about JavaScript execution on the client side, which happens in the visitor’s browser regardless of server speed.
That said, hosting configuration influences INP indirectly:
- A slow TTFB delays when JavaScript starts loading, which delays when it executes
- Server-side rendering (PHP generating HTML) reduces the amount of JavaScript needed to render content, helping INP
- A CDN reduces asset loading times, getting JavaScript to the browser faster
- Caching reduces how much PHP work happens per request, freeing server resources
The biggest INP improvements typically come from JavaScript optimisation, plugin auditing, and reducing third-party script load, rather than from hosting changes alone.
CLS: Cumulative Layout Shift
CLS measures visual stability. It quantifies how much a page’s layout shifts unexpectedly while loading. When content moves around as the page loads — pushing text you were reading down the screen, moving a button just as you click it — that’s layout shift.
CLS is calculated as a score based on the fraction of the viewport affected and the distance the content moves. A score of 0 means no unexpected shifts. Higher scores indicate more instability.
Thresholds:
- Good: under 0.1
- Needs improvement: 0.1 to 0.25
- Poor: over 0.25
Common causes of poor CLS:
Images without dimensions: When the browser loads an image without knowing its dimensions in advance, it can’t reserve space for it. The image loads and pushes surrounding content out of the way. Setting explicit width and height attributes on images (or using aspect-ratio in CSS) tells the browser how much space to reserve before the image loads.
Web fonts causing FOUT: When a web font loads and replaces the fallback font, text can shift if the two fonts have different metrics. Using font-display: swap with carefully matched fallback fonts reduces font-related layout shift.
Dynamically injected content: Banners, cookie consent notices, ads, and other content injected by JavaScript after the initial page load can push existing content down. Cookie consent banners are a particularly common culprit. Reserving space for dynamic content in advance, or ensuring it loads above the fold where it doesn’t displace other content, prevents this.
Late-loading embeds: YouTube videos, Twitter embeds, and similar third-party content that loads after the page renders can cause significant layout shift if space isn’t reserved for them. Using placeholder containers with fixed dimensions prevents this.
How hosting affects CLS
CLS is the Core Web Vital least directly affected by hosting speed. It’s primarily a front-end development issue: how images are handled, how fonts are loaded, how dynamic content is injected.
That said, faster hosting indirectly helps CLS. When a page loads faster overall, there’s less time during which elements can shift. A page that loads in under a second has less opportunity for layout shifts than one that takes 4 seconds.
For WordPress specifically, some page builders inject content in ways that cause layout shift. Hosting configuration doesn’t fix this — it’s a theme and plugin issue.
How Google Measures Core Web Vitals
Google measures Core Web Vitals in two ways.
Field data (CrUX): The Chrome User Experience Report (CrUX) collects real performance data from Chrome users who have opted in to sharing usage data. This is what Google uses for search ranking purposes. Field data reflects actual user experiences across a range of devices and connection speeds over a 28-day rolling window.
Lab data (Lighthouse): PageSpeed Insights and Google’s Lighthouse tool measure performance in a controlled simulated environment. Lab data is useful for debugging and understanding issues but doesn’t directly feed into ranking signals. A good lab score and a good field score can differ significantly — lab tests run on a simulated fast connection and device.
The distinction matters because you can score 100 in PageSpeed Insights (lab data) but still have poor Core Web Vitals in search ranking data (field data) if your real users are on slow connections or devices.
To see your actual Core Web Vitals ranking data, use Google Search Console. The Core Web Vitals report shows real user data grouped by URL and tells you which pages are “good,” “needs improvement,” or “poor” according to field data.
Core Web Vitals and WordPress
WordPress sites have specific challenges and opportunities with Core Web Vitals.
LCP challenges: PHP execution time and database query load directly affect TTFB and therefore LCP. Page caching eliminates most of this. If you’re on a slow shared host without page caching, LCP will suffer. Moving to a host with server-level caching (LiteSpeed with LSCache, or a managed host) is often the single most impactful change.
INP challenges: WordPress’s block editor and popular page builders load substantial JavaScript. The Gutenberg editor itself, WooCommerce, Elementor, and similar tools contribute to main thread congestion. Auditing and reducing JavaScript load (removing unused plugins, choosing lighter alternatives) helps INP.
CLS challenges: Featured images in WordPress often lack explicit dimensions, causing CLS when they load. The WP_Image_Editor generates images with explicit dimensions, but not all themes output these in the HTML. Many WordPress themes inject cookie notices or admin bars that cause layout shifts.
Practical improvements for WordPress Core Web Vitals:
- Enable server-level page caching (LSCache on LiteSpeed hosts, or a caching plugin like WP Rocket on others)
- Use a CDN, preferably Cloudflare, to reduce asset delivery times globally
- Ensure images have explicit
widthandheightattributes in the HTML - Defer non-critical JavaScript using the
deferattribute or a caching plugin’s JS optimisation - Minimise third-party scripts — each one is a potential INP hit
- Reserve space for cookie consent banners to prevent CLS
- Run on a current PHP version (8.2 or 8.3) for maximum execution speed
Frequently Asked Questions
Do Core Web Vitals directly affect search rankings? Yes, they’re a ranking signal. Google confirmed Core Web Vitals as part of the Page Experience ranking signal, which rolled out in 2021. They don’t override content relevance — a highly relevant page with poor Core Web Vitals can still rank for the right query — but between two equally relevant pages, better Core Web Vitals is an advantage.
How do I check my Core Web Vitals? Google Search Console shows field data (real user data) for your entire site. PageSpeed Insights shows both lab and field data for individual URLs. The Chrome DevTools Performance panel and Lighthouse are useful for diagnosing specific issues.
My PageSpeed score is good but my Search Console shows poor Core Web Vitals. Why? PageSpeed Insights lab tests run on a simulated fast connection and mid-range device. Your real users may be on slower connections or lower-end devices. Field data reflects the full range of your actual visitors. A site that scores well in lab conditions can still perform poorly for users on 3G or older Android devices.
How long does it take for Core Web Vitals improvements to affect rankings? CrUX data is collected over a 28-day rolling window. Improvements made today will take up to 28 days to fully reflect in your field data and therefore in ranking signals. Make changes, verify they work in lab testing, then monitor Search Console over the following weeks.
Is there a quick fix for Core Web Vitals? For LCP, enabling page caching is often the quickest significant improvement. For CLS, adding explicit image dimensions is usually fast to implement. INP rarely has a single quick fix and typically requires JavaScript audit and optimisation work. Start with the metric where you’re furthest from “good.”
Does mobile performance matter more than desktop? Google primarily uses mobile field data for ranking signals, since the majority of searches happen on mobile. Your Core Web Vitals scores for mobile are the ones that matter most for ranking. Many sites perform well on desktop but struggle on mobile due to larger resource loads relative to mobile network and CPU constraints. Always optimise for mobile first.